지나가던 개발(zigae)
V8 and WebAssembly: how a modern JavaScript engine buys its speed
2025년 7월 4일 • 🍱🍱 30 min read

Written against V8 v11.x. This goes past the usual “what is a garbage collector” tour and into how V8 handles millions of function calls per second and gigabytes of heap without the user noticing.
Where it starts: how V8 represents an object
JavaScript went from a scripting language to a platform for real applications largely because V8 got good at managing memory. Early V8 stopped the world for tens of milliseconds at a time; today the same work finishes in single-digit milliseconds. The story of how that happened starts one level below the collector, with the way objects are laid out in the first place.
Hidden Classes
Internally every JavaScript object is a HeapObject, and it looks roughly like this:
// V8's internal object layout (simplified)
class HeapObject {
  Map* map_;           // Hidden Class pointer (4/8 bytes)
  Properties* props_;  // dynamic property backing store
  Elements* elements_; // array element backing store
  // ... inline properties
};
Hidden Classes (Maps, in V8’s own vocabulary) are the trick that lets a dynamically typed language reach statically typed performance. Every time an object’s shape changes, V8 transitions it to a new Hidden Class, and those transitions feed the Inline Cache (IC) that makes property access fast.
That’s the payoff. The cost is that this is a lot of structure to keep alive, and keeping it alive cheaply is what the rest of this post is about.
Why this is hard
A modern web app holds a large heap, animates at 60FPS and expects to stay responsive while doing it. The collector has to solve four problems at once:
- Latency vs throughput: keep pause times short without letting the heap grow unbounded
- Fragmentation: an SPA that runs for hours will fragment its heap if you let it
- Cross-heap references: JavaScript and WebAssembly pointing at each other’s objects
- Incremental and concurrent work: collecting without blocking the main thread
Chrome’s Site Isolation raises the stakes further: every iframe gets its own V8 isolate, so per-isolate memory efficiency multiplies. V8’s first answer to all of this is the shape of the heap itself.
The core strategy: a generational heap
Layout and allocation
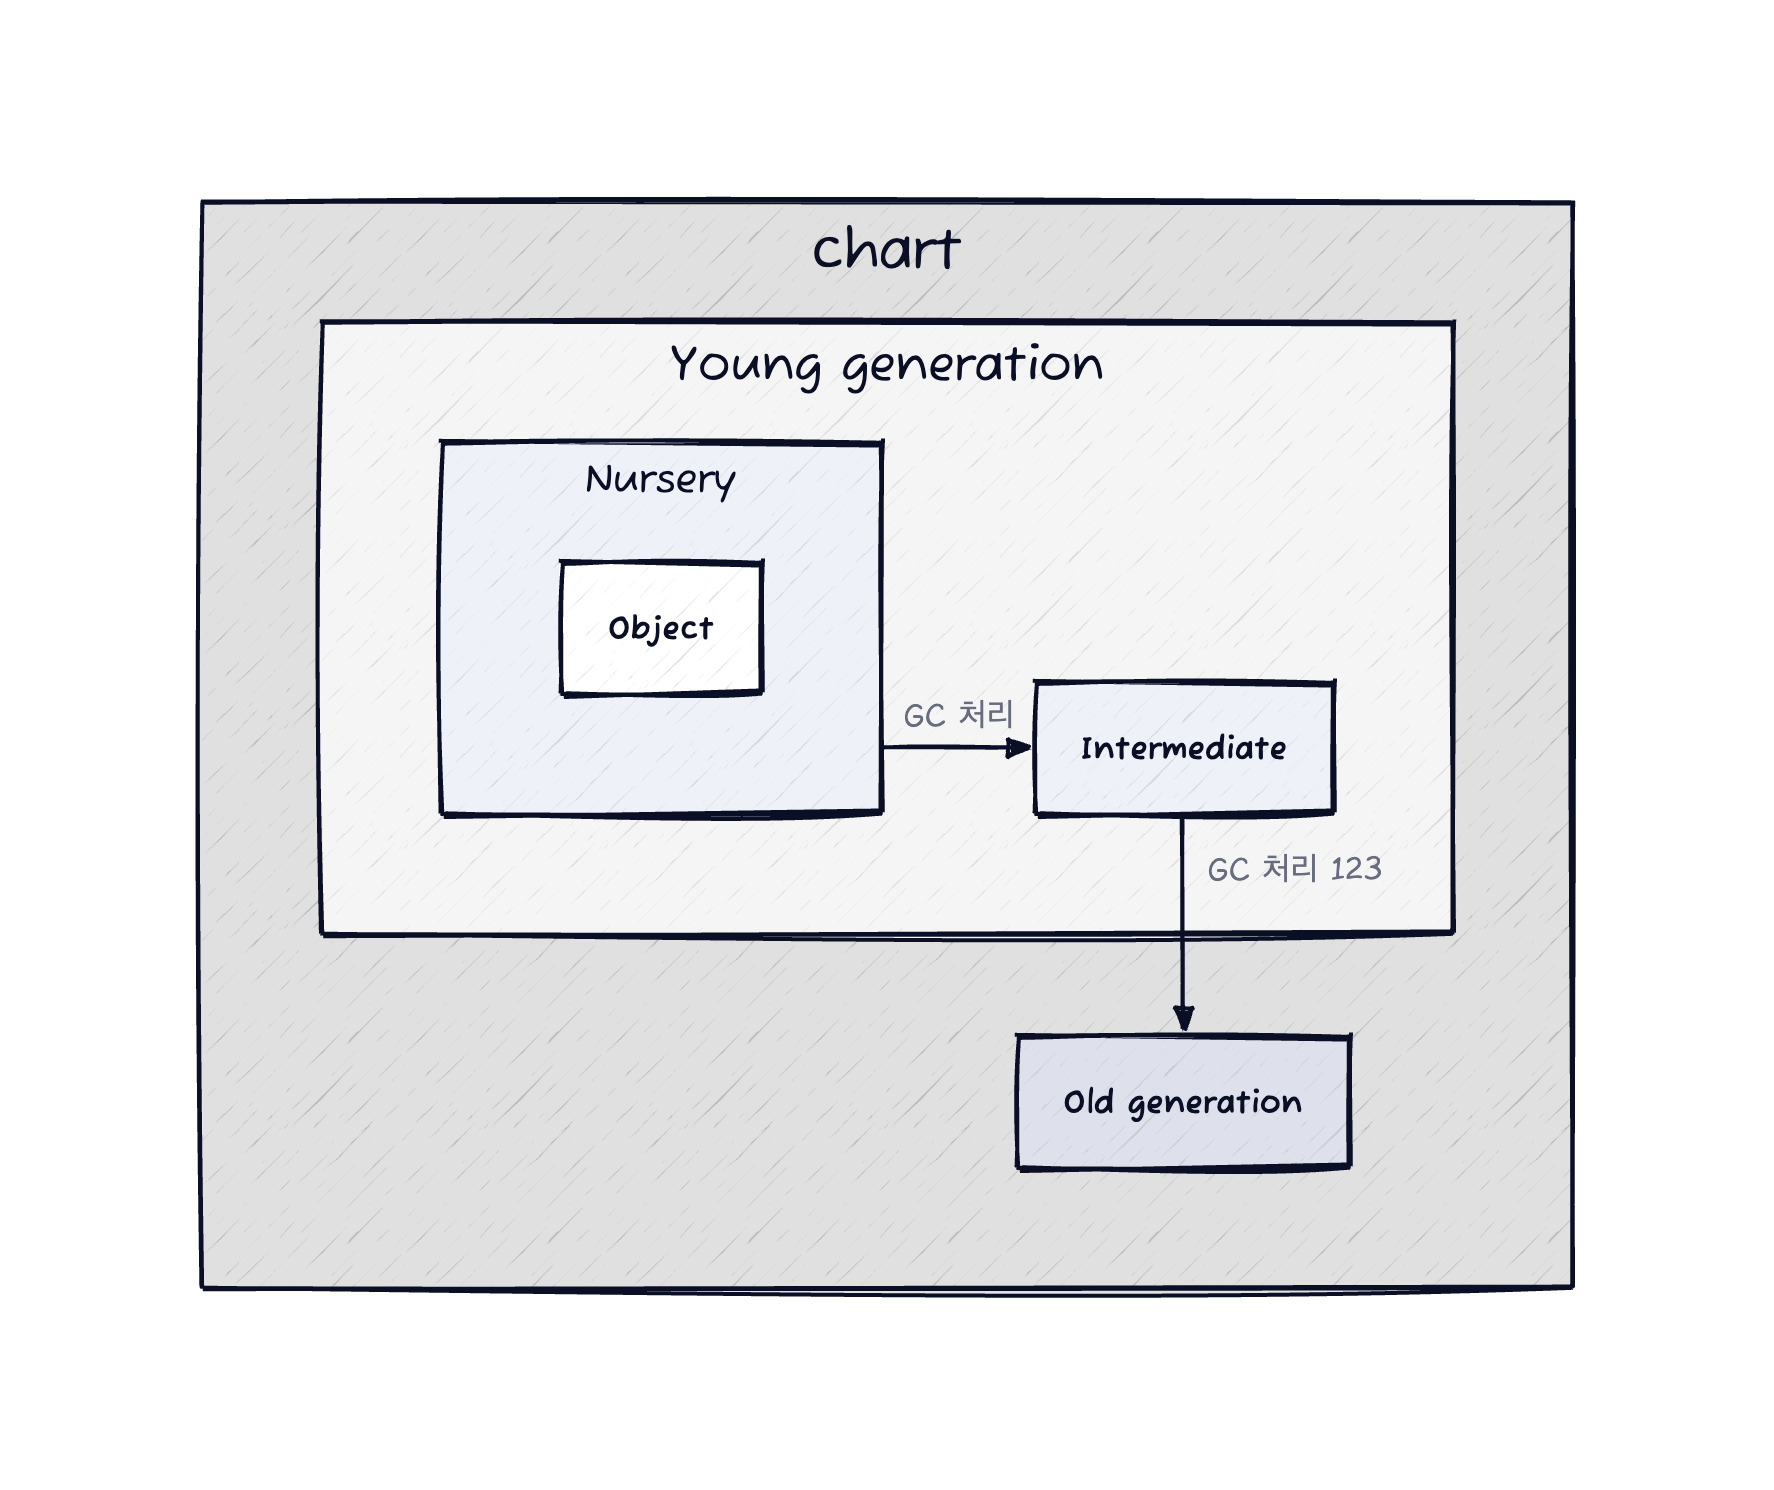
V8’s heap is more than a Young/Old split. The real structure is layered:
V8 Heap (tens of MB to a few GB)
├── Young Generation (1-32MB)
│   ├── Nursery (Semi-space 1)
│   ├── Intermediate (Semi-space 2)
│   └── Survivor Space
├── Old Generation
│   ├── Old Object Space
│   ├── Code Space (executable code)
│   ├── Map Space (Hidden Classes)
│   └── Large Object Space (objects >256KB)
└── Non-movable Spaces
    ├── Read-only Space
    └── Shared Space (cross-isolate)
Splitting the heap by object lifetime lets each region be collected the way that suits it. Allocation itself is nearly free: each thread gets its own TLAB (Thread-Local Allocation Buffer) so threads don’t contend, and inside a TLAB allocation is a bump pointer, which is O(1).
All of which rests on one assumption. We’ll get to whether it holds.
Promotion
Promotion from Young to Old isn’t a simple age counter. V8 uses a mix of heuristics:
- Age-based: survive two scavenges and you’re promoted
- Size-based: if To-space is more than 25% full, promote immediately
- Pretenuring: allocation-site feedback sends objects straight to Old Space from the start
// Pretenuring: V8 learns the pattern
function createLargeObject() {
  return new Array(1000000); // after enough calls, allocated directly in Old Space
}
The write barrier is what makes generational collection possible at all. When an old object starts pointing at a young one, that slot goes into a remembered set and is treated as a root during Minor GC:
// Write barrier (simplified)
if (is_old_object(obj) && is_young_object(value)) {
  remembered_set.insert(obj_address);
}
Does the hypothesis hold?
V8’s own measurements say yes, emphatically:
- 95% of objects die at their first scavenge
- only 2% are ever promoted to the Old Generation
- Young Generation GC takes 10-50ms; Old Generation GC takes 100-1000ms
Which explains why generational collection works so well, right up until you put React on top of it, where the assumption comes apart.
React and V8’s GC, in conflict
1. What Fiber does to the heap
The Fiber architecture that landed in React 16 runs almost exactly counter to the generational hypothesis.
// React Fiber node (simplified)
class FiberNode {
  constructor(element) {
    this.type = element.type;
    this.key = element.key;
    this.props = element.props;

    // these references are the whole problem
    this.child = null;      // child fiber
    this.sibling = null;    // sibling fiber
    this.return = null;     // parent fiber
    this.alternate = null;  // previous render's fiber (double buffering)

    // and these survive a long time
    this.memoizedState = null;     // hook state
    this.memoizedProps = null;     // previous props
    this.updateQueue = null;       // update queue
  }
}

// the fiber tree in a real app
const fiberRoot = {
  current: rootFiber,        // current tree (promoted to Old Generation)
  workInProgress: null,      // in-progress tree (Young Generation)
  pendingTime: 0,
  finishedWork: null
};
Three consequences. Fiber nodes live as long as the component is mounted. Every render keeps an alternate fiber around for double buffering. And the whole tree ends up in the Old Generation, which is the expensive one to collect.
2. Hooks and closures
// the classic leak
function ExpensiveComponent() {
  const [data, setData] = useState([]);

  useEffect(() => {
    // this closure captures the entire component scope
    const timer = setInterval(() => {
      setData(prev => [...prev, generateLargeObject()]);
    }, 1000);

    // forget this return and you've leaked
    return () => clearInterval(timer);
  }, []); // empty deps still allocates the closure

  // a fresh function every render, so more pressure on the Young Generation
  const handleClick = useCallback(() => {
    // captures all of data
    console.log(data.length);
  }, [data]);
}

// a hook pattern V8 has trouble with
function useComplexState() {
  const [state, setState] = useState(() => {
    // runs exactly once, but V8 can't easily know that
    return createExpensiveInitialState();
  });

  // the hook linked list is more work for the collector
  const hook = {
    memoizedState: state,
    queue: updateQueue,
    next: nextHook
  };
}
3. The cost of reconciliation
// how virtual DOM objects get made
function createElement(type, props, ...children) {
  return {
    $$typeof: REACT_ELEMENT_TYPE,
    type,
    key: props?.key || null,
    ref: props?.ref || null,
    props: { ...props, children },
    _owner: currentOwner  // fiber reference
  };
}

// temporaries, one full set per render
function render() {
  // every one of these lands in the Young Generation
  return (
    <div className="container">
      {items.map(item => (
        <Item
          key={item.id}
          data={item}
          onClick={() => handleClick(item.id)}
        />
      ))}
    </div>
  );
  // and most of it is garbage the moment reconciliation ends
}

// plus the work objects reconciliation itself allocates
const updatePayload = {
  type: 'UPDATE',
  fiber: currentFiber,
  partialState: newState,
  callback: commitCallback,
  next: null  // update queue linked list
};
To be fair to React, this is the shape of the problem, not a mistake. The garbage is short-lived, which is exactly what scavenging is good at. The trouble is the part that isn’t garbage.
4. What DevTools adds
// memory React DevTools costs you in development
if (__DEV__) {
  // debug info hung off every fiber
  fiber._debugSource = element._source;
  fiber._debugOwner = element._owner;
  fiber._debugHookTypes = hookTypes;

  // and profiling timings
  fiber.actualDuration = 0;
  fiber.actualStartTime = 0;
  fiber.selfBaseDuration = 0;
  fiber.treeBaseDuration = 0;
}

// GC-conscious component
class MemoryOptimizedComponent extends React.Component {
  shouldComponentUpdate(nextProps) {
    // fewer renders, fewer virtual DOM objects
    return !shallowEqual(this.props, nextProps);
  }

  componentDidMount() {
    // WeakMap so the cache doesn't pin anything
    this.cache = new WeakMap();
  }

  componentWillUnmount() {
    // explicit cleanup
    this.cache = null;
    this.subscription?.unsubscribe();
  }
}
5. React 18’s concurrent features
// automatic batching
function handleMultipleUpdates() {
  // before: each setState triggered its own render
  // now: batched, which means less garbage
  setCount(c => c + 1);
  setFlag(f => !f);
  setItems(i => [...i, newItem]);
}

// Suspense keeps the initial heap smaller
const LazyComponent = React.lazy(() => {
  return import('./HeavyComponent');
});

// useDeferredValue spreads allocation over time
function SearchResults({ query }) {
  const deferredQuery = useDeferredValue(query);

  // non-urgent updates get deferred,
  // which flattens the Young Generation spike
  return <ExpensiveList query={deferredQuery} />;
}
6. What large apps actually do about it
// object pooling, as used in Facebook's list virtualization
const RecyclerListView = {
  viewPool: [],

  getView() {
    return this.viewPool.pop() || this.createView();
  },

  releaseView(view) {
    view.reset();
    this.viewPool.push(view);
  }
};

// Relay's cache, built to stay collectable
class RelayCache {
  constructor() {
    // weak keys, automatic cleanup
    this.records = new WeakMap();

    // TTL so the Old Generation doesn't just grow
    this.ttl = 5 * 60 * 1000; // 5 minutes
  }

  gc() {
    const now = Date.now();
    for (const [key, record] of this.records) {
      if (now - record.fetchTime > this.ttl) {
        this.records.delete(key);
      }
    }
  }
}
None of this is a standoff. The V8 and React teams have been working on it from both ends for years, and React 18’s concurrent features were designed with V8’s incremental GC in mind. If you want the definitive account of one of these collisions, V8’s own post on the React performance cliff is worth your time.
From problem to solution: how the algorithms evolved
A generational heap alone doesn’t get you there. The real question is how to collect garbage without stopping the application, and V8’s history is basically a long series of answers to it.
The starting point, and its ceiling
In 2008, V8 shipped a semi-space collector built on Cheney’s algorithm, the textbook copying collector.
// Cheney's algorithm, in pseudocode
void scavenge() {
  scan = next = to_space.bottom;
  // 1. scan the roots
  for (root in roots) {
    *root = copy(*root);
  }
  // 2. breadth-first from there
  while (scan < next) {
    for (slot in slots_in(scan)) {
      *slot = copy(*slot);
    }
    scan += object_size(scan);
  }
}
Simple and fast, with three problems that turn fatal at web-app scale. It wastes 50% of the space by design, since half the semi-space is always empty. Its breadth-first traversal is hostile to cache locality: objects that are used together end up far apart, and you pay for it in L1/L2 misses. And all of it happens on the main thread.
The turn: tri-color marking
V8 moved to tri-color marking, which is what makes incremental marking possible.
// tri-color invariant
enum MarkColor {
  WHITE = 0,  // unvisited, collectable
  GREY = 1,   // visited, children not yet processed
  BLACK = 2   // fully visited, live
};

// the barrier that keeps incremental marking honest
void WriteBarrier(HeapObject* obj, Object** slot, Object* value) {
  if (marking_state == INCREMENTAL &&
      IsBlack(obj) && IsWhite(value)) {
    // a black object must never point at a white one
    MarkGrey(value);
    marking_worklist.Push(value);
  }
}
Now marking can proceed a slice at a time while JavaScript runs in between. Progress, but the marking still happens on the main thread, and that’s the part worth attacking.
The big swing: Orinoco
Incremental wasn’t enough. Orinoco, started in 2015, was V8’s ground-up rework of the collector under a deliberately aggressive banner: free the main thread. Three techniques came out of it.
1. Parallel
Multiple threads doing GC work at the same time, balanced with work stealing:
class ParallelMarker {
  std::atomic<Object*> marking_worklist;
  std::atomic<size_t> bytes_marked;

  void MarkInParallel() {
    while (Object* obj = marking_worklist.pop()) {
      MarkObject(obj);
      // when the local queue runs dry, take work from a neighbour
      if (local_worklist.empty()) {
        StealFromOtherThread();
      }
    }
  }
};
On an 8-core machine, parallel marking measured 7.2x faster than single-threaded. Fast, but the application is still stopped while it happens.
2. Incremental
Incremental marking chops the work into slices of 5-10ms:
// deciding when to run a step
function shouldTriggerIncrementalStep() {
  const allocated = bytesAllocatedSinceLastStep();
  const threshold = heap.size() * 0.01; // 1% of heap
  return allocated > threshold;
}

// roughly 1MB of marking per step
function incrementalMarkingStep() {
  const deadline = performance.now() + 5; // 5ms budget
  while (performance.now() < deadline && !marking_worklist.empty()) {
    markNextObject();
  }
}
Internally V8 tracks a marking progress bar so that marking speed keeps pace with allocation speed. Important, but still main-thread work. The real answer was to get off it entirely.
3. Concurrent
Concurrent marking is the hardest of the three and by far the most effective. V8 uses snapshot-at-the-beginning (SATB):
class ConcurrentMarker {
  void WriteBarrierSATB(HeapObject* obj, Object** slot, Object* new_value) {
    Object* old_value = *slot;
    if (concurrent_marking_active &&
        IsWhite(old_value) && !IsWhite(new_value)) {
      // preserve the old reference for the snapshot
      satb_buffer.push(old_value);
    }
    *slot = new_value;
  }

  void ConcurrentMarkingTask() {
    // running on a helper thread
    while (!marking_worklist.empty()) {
      Object* obj = marking_worklist.pop();
      // lock-free marking via CAS
      if (TryMarkBlack(obj)) {
        VisitPointers(obj);
      }
    }
  }
};
Concurrent marking cut Major GC pause times by 60-70%.
V8 today: the three techniques together
Those three ideas are now the core of the collector. Here’s how each phase uses them.
Young Generation: parallel scavenging
Young GC is fully parallel. The main thread does stop, but only briefly, while several helper threads work at once.
class ParallelScavenger {
  void Scavenge() {
    // 1. scan roots in parallel
    parallel_for(roots, [](Root* root) {
      EvacuateObject(root->object);
    });

    // 2. work stealing keeps threads busy
    while (has_work() || can_steal_work()) {
      Object* obj = get_next_object();
      CopyToSurvivor(obj);
    }

    // 3. pointer updates go parallel too
    parallel_update_pointers();
  }
};
On an 8-core machine that took Young GC from 50ms down to 7ms.
Old Generation: as concurrent as possible
Old GC leans on concurrency wherever it can:
- Concurrent marking starts in the background while JavaScript keeps running
- Incremental marking: the main thread pitches in with 5ms slices
- Finalization: a short pause to finish marking (2-3ms)
- Concurrent sweeping: reclaiming memory, back in the background
// what the timeline looks like
[JS running]-->[concurrent marking starts]-->[JS]-->[5ms step]-->[JS]-->[2ms finalize]-->[JS]
      ↑                    ↑                          ↑              ↑
allocation limit    background work           cooperative      minimal pause
Idle-time GC
Chrome’s idle periods are a resource, and V8 spends them:
// hooked into requestIdleCallback
requestIdleCallback((deadline) => {
  const timeRemaining = deadline.timeRemaining();

  if (timeRemaining > 10) {
    // enough room for a major collection
    triggerMajorGC();
  } else if (timeRemaining > 2) {
    // just enough for a minor one
    triggerMinorGC();
  }
});
The combination is why you can hold 60FPS and still have the heap under control. The collector does most of its work in the gaps.
A closer look at the implementations
Concurrent marking, in detail
Everything in concurrent marking exists to preserve the tri-color invariant while the mutator keeps changing the graph underneath it.
class ConcurrentMarkingVisitor {
  void VisitPointers(HeapObject* host, ObjectSlot start, ObjectSlot end) {
    for (ObjectSlot slot = start; slot < end; ++slot) {
      Object* target = *slot;

      // 1. already handled
      if (IsBlackOrGrey(target)) continue;

      // 2. CAS, because other threads are doing the same thing
      if (CompareAndSwapColor(target, WHITE, GREY)) {
        // 3. push onto a lock-free worklist
        marking_worklist_.Push(target);

        // 4. and record the cross-generation reference
        if (host->IsInOldSpace()) {
          remembered_set_.Insert(slot);
        }
      }
    }
  }
};
How the parallel scavenger splits work
class WorkStealingQueue {
  bool TrySteal(Object** obj) {
    // 1. local queue first
    if (local_queue_.Pop(obj)) return true;

    // 2. empty? steal from someone else
    for (int i = 0; i < num_threads; i++) {
      if (global_queues_[i].TryStealHalf(&local_queue_)) {
        return local_queue_.Pop(obj);
      }
    }

    // 3. everyone's empty, so we're done
    return false;
  }
};
The object graph is wildly uneven. One thread can draw a subtree with a hundred thousand nodes while another gets three, so static partitioning would leave most cores idle. Stealing is what turns extra cores into actual speed.
The other axis: the compiler
Memory is half the story. The other half is how JavaScript gets turned into machine code, and V8’s compiler pipeline has been rebuilt just as thoroughly as its collector.
Generation 1: Full-codegen + Crankshaft (2010-2016)
Two compilers, one fast and one good.
// the kind of function that gets optimized
function calculateSum(arr) {
  let sum = 0;
  for (let i = 0; i < arr.length; i++) {
    sum += arr[i];  // hot loop, Crankshaft's territory
  }
  return sum;
}

// Full-codegen: compiles fast, runs slow
// -> every function goes straight to native code

// Crankshaft: compiles slow, runs fast
// -> only hot functions get this treatment
It worked, and then it stopped scaling. Compiling everything to native code costs a lot of memory. Deoptimization happened constantly. And Crankshaft simply couldn’t handle a lot of the JavaScript people were actually writing: try/catch, generators, let/const in some positions.
Generation 2: Ignition + TurboFan (2016-present)
In 2016 the team replaced the whole pipeline. Ignition is an interpreter that compiles JavaScript to compact bytecode, cutting memory use by 50-75% versus Full-codegen. TurboFan replaced Crankshaft as the optimizing compiler and does considerably more sophisticated work.
// the path a function takes
function Component({ data }) {
  // 1. parse -> AST
  // 2. Ignition lowers it to bytecode
  const result = data.map(item => item * 2);

  // 3. execution counts and type info accumulate (feedback vector)
  // 4. hot enough, and TurboFan takes over
  return result;
}

// roughly what the bytecode looks like
/*
  LdaNamedProperty a0, [0]    // load data
  CallProperty1 [1], a0, a1   // call map
  Return
*/
The wins compound. Bytecode is much smaller than native code, which matters enormously on mobile. It’s generated fast, so startup improves. And optimization becomes something you spend only where it pays.
Inline caching and Hidden Classes
Inline caching attacks the single biggest tax on a dynamic language: property access. Every obj.property in principle requires checking the object’s shape and then finding the property. An IC remembers what it saw last time at that call site and skips the lookup when the shape matches.
Hidden Classes are what it matches against, the internal metadata describing an object’s shape. Objects with the same properties added in the same order share one, and that sharing is what gets property access down to something close to a C++ struct field load.
// how transitions happen
class Point {
  constructor(x, y) {
    this.x = x;  // Hidden Class C0 -> C1
    this.y = y;  // Hidden Class C1 -> C2
  }
}

// monomorphic: one shape, fully optimizable
function getX(point) {
  return point.x;
}

// polymorphic: many shapes, much harder
function getValue(obj) {
  return obj.value;
}

// in a component
function UserProfile({ user }) {
  // consistent props shape means the IC stays hot
  return <div>{user.name}</div>;
}

// and the anti-pattern
function BadComponent({ data }) {
  if (someCondition) {
    data.extraField = 'value';  // shape change, cache blown
  }
  return <div>{data.value}</div>;
}
The optimization feedback loop
V8’s adaptive optimization decides what to compile based on what actually runs, in three stages:
- Cold: first execution, interpreted by Ignition
- Warm: called repeatedly, collecting type feedback along the way
- Hot: past a threshold (typically 1,000-10,000 calls), TurboFan compiles it
The point of the loop is that optimization follows real usage instead of a guess, so you don’t spend compile time on code nobody calls twice.
// the three tiers, side by side
class OptimizationExample {
  // cold: interpreted, and that's fine
  rarely_called() {
    return Math.random();
  }

  // warm: type feedback accumulating
  sometimes_called(x, y) {
    return x + y;
  }

  // hot: TurboFan compiles this
  frequently_called(arr) {
    let sum = 0;
    for (let i = 0; i < arr.length; i++) {
      sum += arr[i];
    }
    return sum;
  }
}

// what gets recorded per call site
let feedback = {
  callCount: 0,
  parameterTypes: [],
  returnTypes: []
};

// render functions are called constantly, so they optimize well
function FrequentlyRendered({ items }) {
  return items.map((item, i) => (
    <Item key={i} data={item} />
  ));
}
What TurboFan actually does
TurboFan isn’t a simple JIT. It builds a Sea of Nodes intermediate representation and runs real optimization passes over it.
// 1. inlining
// removes call overhead, typically 10-30%
function add(a, b) { return a + b; }
function calculate(x, y) {
  return add(x, y) * 2;
  // after inlining: return (x + y) * 2;
  // and now further optimizations become visible
}

// 2. escape analysis
// an object that never leaves the function never needs the heap
function createPoint() {
  const point = { x: 10, y: 20 };  // would normally be heap-allocated
  return point.x + point.y;        // but it never escapes
  // after optimization: return 30;
  // no allocation, nothing for the collector to do
}

// 3. loop optimizations
function processArray(arr) {
  // unrolling: fewer iterations, fewer branch mispredictions
  for (let i = 0; i < arr.length; i += 4) {
    arr[i] = arr[i] * 2;
    arr[i+1] = arr[i+1] * 2;
    arr[i+2] = arr[i+2] * 2;
    arr[i+3] = arr[i+3] * 2;
  }
  // up to 4x on the right workload, thanks to pipeline utilization
}

// 4. and how React benefits
const MemoizedComponent = React.memo(({ data }) => {
  // the props comparison itself gets optimized
  return <ExpensiveRender data={data} />;
});
Watching it happen
You don’t have to take any of this on faith. Chrome DevTools’ Performance panel shows it, and Node’s --trace-opt flag shows it in more detail.
// crude but effective
function profileFunction() {
  // 1. first run: interpreted
  console.time('cold');
  calculateSum([1,2,3,4,5]);
  console.timeEnd('cold');

  // 2. warm it up
  for (let i = 0; i < 1000; i++) {
    calculateSum([1,2,3,4,5]);
  }

  // 3. now it's compiled
  console.time('hot');
  calculateSum([1,2,3,4,5]);
  console.timeEnd('hot');  // noticeably faster
}

// or watch the decisions directly
// node --trace-opt --trace-deopt script.js
Where React and V8 line up
React was written by people who knew what V8 rewards, and React 18’s concurrent features fit the engine’s optimization model closely.
// compiler-friendly by construction
function OptimizedComponent() {
  // 1. stable types
  const [count, setCount] = useState(0);  // always a number

  // 2. predictable structure
  const content = useMemo(() => {
    return count > 10 ? <Heavy /> : <Light />;
  }, [count]);

  // 3. stable function identity
  const handleClick = useCallback((e) => {
    // same reference every render, so the IC stays monomorphic
    setCount(c => c + 1);
  }, []);

  return <div onClick={handleClick}>{content}</div>;
}

// React Compiler (experimental) pushes this further,
// doing at build time what would otherwise be runtime work
Anti-patterns worth avoiding
A handful of common patterns actively fight the optimizer. Fixing them is often worth 2-10x.
// anti-pattern 1: churning the Hidden Class
function bad() {
  const obj = {};
  obj.a = 1;      // HC1
  obj.b = 2;      // HC2
  delete obj.a;   // HC3, and now you're deoptimized
}

// fix: declare the shape up front
function good() {
  const obj = { a: 1, b: 2 };
  if (needToRemove) {
    obj.a = undefined;  // undefined instead of delete
  }
}

// anti-pattern 2: too many shapes at one call site
function processItems(items) {
  items.forEach(item => {
    // item is a different shape every time, so nothing to cache
    console.log(item.value);
  });
}

// fix: one shape
interface Item {
  value: number;
  type: string;
}
function processTypedItems(items: Item[]) {
  items.forEach(item => console.log(item.value));
}
Compilers made JavaScript fast, and frameworks like React quietly do the work of staying on the fast path so you mostly don’t have to think about it. But none of it survives careless memory use, which brings us back to the heap.
Supporting techniques
Around the core collector sits a set of smaller optimizations. Each one only matters in particular situations, but where they apply they matter a lot.
1. Object pooling
Pooling means creating objects once and reusing them instead of allocating and discarding. It pays off in exactly the places you’d expect: games, animation, anything that produces hundreds of objects per frame.
Instead of letting an object die, you hand it back to a pool and take it out again when you need one. Young Generation pressure drops, and so does collection frequency.
// a pool, minus the details
class ObjectPool {
  constructor(createFn, maxSize = 100) {
    this.createFn = createFn;
    this.pool = Array(maxSize).fill(null).map(createFn);
  }

  acquire() {
    return this.pool.pop() || this.createFn();
  }

  release(obj) {
    this.pool.push(obj);
  }
}

// bullets in a game, for instance
const bulletPool = new ObjectPool(
  () => ({ x: 0, y: 0, active: false }),
  1000
);
Measured on a particle system, pooling cut GC pauses by 70% and effectively eliminated dropped frames. The gap was widest on mobile, where there’s less headroom to hide a pause in.
// the difference, concretely
const particles = [];
for (let i = 0; i < 10000; i++) {
  // without pooling: a new object every iteration
  particles.push({ x: Math.random() * 800, y: 600 });

  // with pooling: reuse
  // const p = pool.acquire();
  // p.x = Math.random() * 800;
}
Worth saying: pooling is not free. You’re taking manual responsibility for object lifetimes in a language that was designed to take that away from you, and a pooled object that keeps a stale reference is a leak the collector can’t help you with. Reach for it when you’ve measured a problem, not by default.
2. Compaction
Fragmentation is the chronic disease of long-running applications. Allocate and free objects of varying sizes for long enough and the heap fills with holes too small to use. You have plenty of free memory and still can’t satisfy a large allocation.
V8’s answer is to move live objects together during Major GC, consolidating the free space behind them. It’s expensive, which is why V8 prefers to do it during idle time.
// how fragmentation gets made
class FragmentationExample {
  constructor() {
    this.data = [];

    // mix large and small objects, free some of each,
    // and the free space ends up scattered
  }
}

// what you can do about it from the outside
const optimized = {
  smallObjects: [],     // group by size
  largeObjects: [],
  buffer: new ArrayBuffer(1024 * 1024), // or take contiguous memory yourself
};
3. Pointer compression
Shipped in Chrome 80, and one of the largest single memory wins V8 has had. On a 64-bit machine every pointer costs 8 bytes, which for a language that allocates as many small objects as JavaScript is a lot of overhead for very little addressing range that anyone uses.
The trick: confine JavaScript objects to a 4GB “cage” and store addresses within it as 32-bit offsets. Real addresses are reconstructed as base + offset.
Chrome measured an average 43% reduction in V8 heap usage on typical pages. React apps benefit disproportionately, because a component tree is mostly pointers.
// pointer compression (Chrome 80+)
// before: 8 bytes per reference (64-bit)
// after:  4 bytes per reference (32-bit offset)

const obj = {
  ref1: {},  // 8 bytes -> 4 bytes
  ref2: {},
  ref3: {}
};
4. String interning
Interning stores one copy of a given string instead of many, the same idea as Java’s string pool, except V8 does it for you.
Short strings and frequently used ones get interned automatically. Event type strings like "click" and "hover" exist once in memory no matter how many thousands of times they appear.
You can help by reusing string constants rather than constructing equivalent strings at runtime. Redux action types and event names are the usual candidates.
const EVENT_TYPES = {
  CLICK: 'click',
  HOVER: 'hover'
};

// used 10,000 times, stored once
events.push({ type: EVENT_TYPES.CLICK });
5. WeakMap and WeakSet
The weak collections from ES6 are the most direct tool JavaScript gives you for preventing leaks.
A regular Map holds its keys strongly. Put a DOM node in one and that node cannot be collected until you remove the entry by hand, and that “by hand” is where leaks come from, because the removal is easy to forget and impossible to notice.
A WeakMap holds its keys weakly. When nothing else references the key, the entry disappears on its own. That makes it the right structure for caches, metadata attached to DOM nodes, and private per-instance data.
// WeakMap: cleans itself up
const cache = new WeakMap();

elements.forEach(el => {
  cache.set(el, { data: 'metadata' });
  // remove el from the document and the cache entry goes with it
});

// Map: your responsibility, and a leak if you forget
const map = new Map();
These techniques aren’t a checklist to apply all at once. You pick the one that fits the problem. Games and real-time apps get the most out of them.
What Orinoco actually bought
Numbers, before and after:
- Before Orinoco (2016): GC pauses of 10-50ms
- After Orinoco (2019): GC pauses of 2-15ms, a 40-60% reduction
In SPA workloads, average interaction latency improved roughly 18% after Orinoco landed.
Impressive, and then a different kind of workload showed up.
WebAssembly and how V8 runs it
WebAssembly is a low-level binary format built to run at near-native speed in a browser. It’s how C++, Rust and Go code ends up on a web page, and V8 has an entire optimization strategy dedicated to executing it well.
1. Tiered compilation
WASM modules can be several megabytes. Compile them thoroughly and startup is terrible; compile them carelessly and you’ve given up the performance you came for.
V8 does what it does for JavaScript: two tiers. Liftoff, a baseline compiler, gets you executing quickly, while TurboFan produces optimized code in the background.
// tiered compilation, from the outside
async function loadWasm() {
  const response = await fetch('module.wasm');
  // streaming: compile while it downloads
  const module = await WebAssembly.compileStreaming(response);

  // Liftoff: ~10ms/MB (baseline, fast)
  // TurboFan: ~100ms/function (optimized, background)

  return WebAssembly.instantiate(module, imports);
}
2. Dynamic tiering
Chrome 96 added dynamic tiering, which decides what to re-compile based on how often each function actually runs. On mobile this matters for battery as much as for speed, since optimizing code nobody calls is pure waste.
The mechanism is straightforward: everything starts on Liftoff, execution counters identify the hot functions, anything past the threshold (roughly 1,000 calls) gets recompiled by TurboFan, and the threshold itself adapts to the workload.
// conceptually
const funcStats = {
  add: { calls: 0, optimized: false },
  matrixMultiply: { calls: 0, optimized: false }
};

// past the threshold, recompile
if (funcStats.matrixMultiply.calls++ > 1000) {
  // Liftoff -> TurboFan
}

// and from React's side, it's just a module
const wasm = await WebAssembly.instantiateStreaming(
  fetch('module.wasm')
);
wasm.instance.exports.processImage(data);
3. Memory, and sharing a collector
WebAssembly traditionally used linear memory, one flat byte array. Perfect for C and C++, awkward the moment you want to hand a structured object back and forth with JavaScript.
The WasmGC proposal (Chrome 119+) gives WebAssembly access to the same garbage collector JavaScript uses. That buys you references between JS objects and WASM structs, no manual malloc/free, cycles collected automatically, and a single predictable pause instead of two memory systems with separate behaviors.
// linear memory: still how most WASM works today
const memory = new WebAssembly.Memory({
  initial: 256,   // 16MB
  maximum: 32768  // 2GB
});

// moving data across the boundary
const view = new Uint8Array(memory.buffer, ptr, size);
view.set(data);  // JS -> WASM

// WasmGC (Chrome 119+): managed objects instead
// (type $point (struct (field $x f64) (field $y f64)))
// same collector as JavaScript
4. SIMD
SIMD, or single instruction multiple data, processes several values with one instruction. V8 supports WebAssembly SIMD, which means access to the CPU’s vector units from the browser.
What that’s worth in practice: four floats added at once for a 4x speedup on vector math, roughly 30x on a 512x512 matrix multiply, real-time blur and sharpen filters on images, and fluid simulations that hold 60fps.
// scalar JavaScript: one at a time
for (let i = 0; i < arr.length; i++) {
  result[i] = a[i] + b[i];
}

// WASM SIMD: four at a time
// (f32x4.add (v128.load a) (v128.load b))

// measured: JS ~450ms -> WASM ~50ms -> SIMD ~15ms
5. Code caching
Large modules (10MB and up) can take seconds to compile. Doing that on every page load is not acceptable, so V8 caches the result: optimized machine code goes into IndexedDB, WebAssembly.Module.serialize() gives you the compiled artifact, a cache hit skips compilation entirely, and timestamps handle invalidation.
// caching compiled modules
async function loadWithCache(url) {
  // 1. check the cache
  let module = await cache.get(url);

  if (!module) {
    // 2. compile and store
    module = await WebAssembly.compileStreaming(
      fetch(url)
    );
    await cache.store(url, module);
  }

  return module;  // no recompilation
}
6. Does it pay off?
On compute-heavy work like matrix multiplication, WebAssembly runs 9-30x faster than JavaScript. The applications that exist because of that are the real argument: AutoCAD Web renders 3D CAD in a browser, Google Earth streams large 3D map data in real time, Figma runs its vector engine in WASM, and Photoshop Web applies filters at close to native speed.
// matrix multiply, 512x512
// JavaScript:     ~450ms
// WebAssembly:    ~50ms  (9x)
// WASM + SIMD:    ~15ms  (30x)

// image filtering from React
const applyFilter = async (imageData) => {
  // JS filter:   ~50ms
  // WASM filter: ~5ms
  return wasmFilters[filterType](imageData);
};
The pattern that’s emerging is a split one: JavaScript for business logic and UI, WebAssembly for the parts where the numbers hurt.
What this looks like in production
1. Gmail’s incremental DOM updates
class IncrementalRenderer {
  constructor() {
    this.pendingUpdates = new WeakMap();
    this.updateQueue = [];
  }

  scheduleUpdate(element, patch) {
    // WeakMap so a detached element doesn't stay pinned
    this.pendingUpdates.set(element, patch);

    // spend idle time, not frame time
    requestIdleCallback(() => {
      this.processBatch();
    }, { timeout: 16 }); // one frame
  }

  processBatch() {
    const batchSize = 100;
    for (let i = 0; i < batchSize && this.updateQueue.length; i++) {
      const update = this.updateQueue.shift();
      update.apply();
    }
  }
}
Result: 70% fewer major collections, and frames held 95% of the time.
2. Discord’s message pooling
class MessagePool {
  constructor(size = 1000) {
    this.pool = [];
    this.activeMessages = new Set();

    // preallocate
    for (let i = 0; i < size; i++) {
      this.pool.push(new Message());
    }
  }

  acquire() {
    let msg = this.pool.pop();
    if (!msg) {
      // ran dry, so grow, but say so
      console.warn('Pool expansion triggered');
      msg = new Message();
    }
    this.activeMessages.add(msg);
    return msg.reset();
  }

  release(msg) {
    if (this.activeMessages.delete(msg)) {
      this.pool.push(msg);
    }
  }
}
Result: 85% fewer Young Generation collections and 30% less memory used.
Measuring it yourself
// GC events via the Performance API
class V8Profiler {
  static measureGC() {
    const obs = new PerformanceObserver((list) => {
      for (const entry of list.getEntries()) {
        if (entry.entryType === 'measure' &&
            entry.detail?.kind === 'gc') {
          console.log(`GC Type: ${entry.detail.type}`);
          console.log(`Duration: ${entry.duration}ms`);
          console.log(`Heap Before: ${entry.detail.usedHeapSizeBefore}`);
          console.log(`Heap After: ${entry.detail.usedHeapSizeAfter}`);
        }
      }
    });

    obs.observe({ entryTypes: ['measure'] });
  }

  static getHeapSnapshot() {
    if (typeof gc !== 'undefined') {
      gc(); // requires --expose-gc
    }

    return performance.measureUserAgentSpecificMemory();
  }
}
Pointer compression (Chrome 89)
Environment: 8GB RAM, 4-core CPU
Apps: Gmail, Google Docs, YouTube

Results:
- V8 Heap: 1.2GB -> 684MB (43% less)
- Renderer Memory: 2.1GB -> 1.68GB (20% less)
- Major GC Time: 45ms -> 38.7ms (14% less)
- FID p95: 24ms -> 19ms
Orinoco vs the old collector
Benchmark: Speedometer 2.0

Legacy (2015):
- Score: 45 ± 3
- GC Pause p50: 23ms
- GC Pause p99: 112ms
- Total GC Time: 3.2s

Orinoco (2019):
- Score: 78 ± 2 (73% better)
- GC Pause p50: 2.1ms (91% lower)
- GC Pause p99: 14ms (87% lower)
- Total GC Time: 0.9s (72% lower)
The p99 line is the one to read twice. A p50 of 2ms is nice; a p99 of 112ms dropping to 14ms is the difference between an app that occasionally stutters for no visible reason and one that doesn’t.
A checklist
const optimizationChecklist = {
  // 1. Hidden Classes
  avoidDynamicProperties: true,
  useConstructorsConsistently: true,

  // 2. inline caches
  avoidPolymorphicCalls: true,
  limitFunctionTypes: 4,

  // 3. memory
  useObjectPools: true,
  limitClosureScopes: true,
  preferTypedArrays: true,

  // 4. fewer collections
  batchDOMUpdates: true,
  useWeakReferences: true,
  clearLargeObjects: true
};
Wrapping up
V8 stopped being a JavaScript engine some time ago; it’s a system. It’s not an accident that its components are named after engine parts and car technology: Ignition, TurboFan, Orinoco. That’s the shape of the thing: separate pieces, machined to fit, and the whole point is that they mesh. It’s the reason a browser tab can now do work that used to require a native application.
I won’t pretend this was an easy post to write. Most of it came out of V8 team papers, their blog, and reading the source, and some of it I only understood on the third pass. What I keep coming back to is a smaller question than any of the machinery above: given all this engineering, what is it actually asking of us? Mostly, I think, that we stop making the engine guess: keep object shapes stable, keep types consistent, and don’t hold references longer than we need to. None of that is exotic. It’s just the part we’re responsible for.
Last thing: thanks to everyone who’s contributed to V8. It’s an extraordinary piece of open source.
Bonus: what’s still open
- Better WASM integration: finishing WasmGC
- ML-driven optimization: pattern-based automatic tuning
- New hardware: ARM and RISC-V tuning